
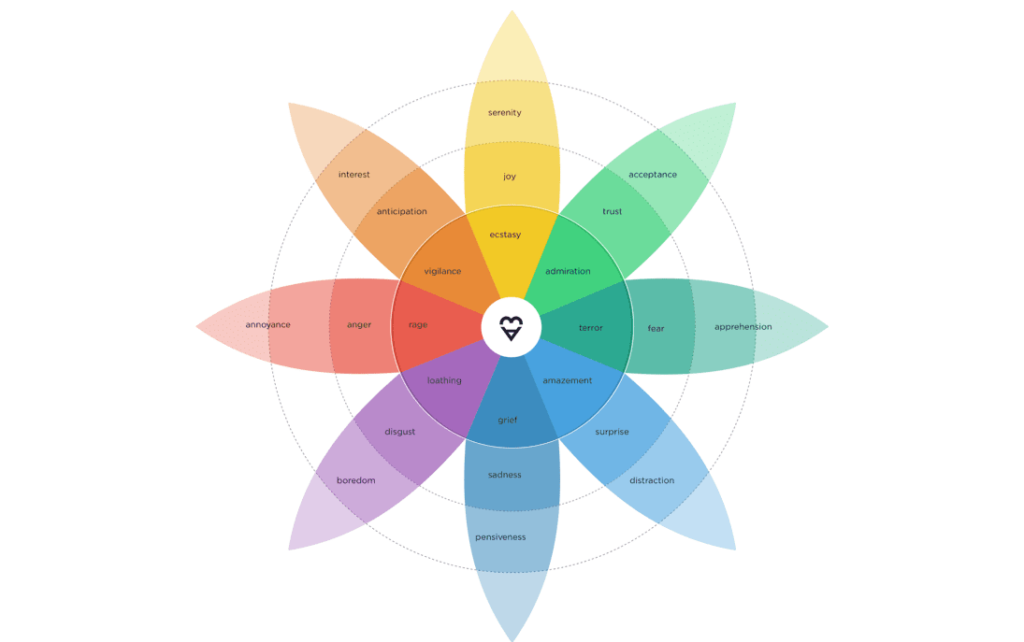
If you are still reading your customers through positive, negative and neutral, you are working from three categories where there are twenty-four signals. Here is what sits in the difference.
Text analysis has improved faster than the use anyone makes of it. Most organisations now collect far more open-text customer feedback than they can read, run it through a tool that sorts it into three piles, and report the proportions. That is where the process stops, and it stops one layer above the thing that predicts what customers do next.
Sentiment and emotion are not the same measurement
Sentiment is a polarity. It places a comment on a line from positive to negative, usually with a neutral point in the middle. As a first pass over a large volume of text it is genuinely useful, and it is fast.
Its limit is that a polarity has no room in it. Consider three customers, all recorded as negative about a late delivery. One is angry. One is anxious about whether the order arrives at all. One is disappointed, in the flat way that means they have stopped expecting better.
Those three people will do three different things. The angry one complains, escalates, and hands you a chance to put it right. The anxious one contacts support repeatedly and can be reassured. The disappointed one says nothing and quietly stops ordering. Sorted into a single negative bucket, they are one number, and the differences that predict their behaviour have been averaged away before anyone looked.
The same flattening happens at the other end. Delight and mild approval both land in positive, and only one of them produces an advocate.
Emotions are also not a subset of sentiment. Several of the ones that matter most commercially do not sit cleanly on the positive-to-negative line at all: anticipation, surprise, confusion, apprehension. A polarity has nowhere to put them.
How emotion is measured
Adoreboard reads open-text customer feedback against Plutchik’s Wheel of Emotions, one of the most consistently referenced models in the field.
Eight base emotions, each measured at three levels of intensity, gives 24 distinct signals. Intensity is the part that does the work. Annoyance, anger and rage are the same emotion at three strengths, and they carry three different levels of commercial risk. A programme that can separate annoyance from rage can tell the difference between a customer who wants a better answer and one who has already gone.
Those signals are then attached to specific themes in the feedback, so the output is not a mood reading for the brand as a whole. It is a specific emotional profile against a specific issue: what customers feel about renewal pricing, about the app login, about the returns process, and how strongly.
From emotion to Trust
Emotion is the input. Trust is what you manage.
The 24 signals compound into a Trust Score, a single measure of the emotional health of a customer base on a 0 to 100 index. Trust matters more than satisfaction because it behaves differently in time: satisfaction reports on a journey that has already finished, while Trust moves before the behaviour does. That difference is the whole value of a leading indicator. It gives you a quarter to act in rather than a quarter to explain.
This is measurable rather than theoretical. In a validation study using more than 20,000 real customer records from a major North American telecommunications provider, emotion-based measurement predicted churn with 86% accuracy, and the prediction landed within 1% of actual historical churn. The predictions were available before the cancellations, not after them.
If sentiment can tell you what has already happened, in three categories, emotion tells you why, and Trust tells you what is about to happen next.
What the emotion layer makes possible
Two things, and the second is the one that changes budgets.
Root cause, rather than proportion. Because each emotional signal is attached to a theme, you can ask why a score moved and get an answer that names something fixable. That is the practical difference between a report that says negative sentiment rose four points and one that says apprehension about renewal pricing rose sharply among customers in their second year.
A financial number against each issue. Once you can measure the intensity of feeling about a specific theme, and you can attach that theme to the customers who raised it, you can attach revenue to it. The output is a ranked list of experience issues ordered by financial exposure rather than by how often each was mentioned, which is a different document from a CX report. It is a business case.
Value Retail, which creates and operates The Bicester Collection, uses that connection directly. Their Director of Guest Experience Development, Mazhar Butt, put it this way:
“By merging spend data with the Adoreboard predictive insights, we could move beyond correlation and actually measure opportunity loss, how much money we have potentially lost when Trust falls below target. It makes the cost of poor customer experience visible in real financial terms.”
Not all text analysis is the same
The practical test is simple. Ask your current tool to show you the difference between your disappointed customers and your angry ones, and then ask what each group is worth.
If the answer comes back as a proportion of negatives, you are working from three categories. The signal that predicts what your customers do next is in the words underneath, and it is already sitting in the feedback you collect.
Curious what this looks like on your own data? Book a 15-minute walkthrough: adoreboard.com/demo