
If we are to believe that customer experience is a battleground, how do you win?
Simple. Focus on the marginal gains.
I recently explored the concept of marginal gains with Yvonne O’Brien, a leading light in helping brands achieve marginal gains, at What’s Possible 2019 panel organised by Specialist Works agency in London. And also in a follow up webinar just this month on how marginal gains can be applied to Customer Experience – you can listen to here.
Here are my takeaways for achieving marginal gains:
- Create a hierarchy that’s accessible for CX professionals to achieving marginal gains
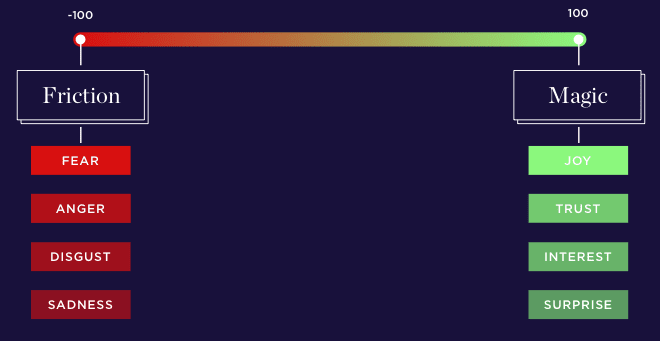
- Use a measurement framework for customer emotions to identify fundamentals (surface any friction in experience) & then build marginal gains (by creating differentiators for magic in the experience)
- Change your mindset from viewing customer as statistics to customers as people (credit: Alex Genov from Zappos)
Why is it a good idea to focus on marginal gains? Well, nearly all (75%) of CX initiatives fail to deliver for business. A useful suggestion by Forrester analyst Maxie Schmidt is that we should stop decorating our customer experience and start renovating the foundations. For me, this provides a good way into thinking about marginal gains for Customer Experience.
So what are marginal gains?
Marginal gains allow us to break down any plan or process and look at how the individual parts can be optimised. Taking time to work on the smaller individual parts of a larger process can deliver small improvements almost immediately. These small changes are quick wins for the company and can add up to create major successes [1].
The concept was popularised by Sir Dave Brailsford, head of Team GB Cycling. He took over at the helm at a time when British Cycling hadn’t won a gold medal in its 76-year history. He made a huge gamble on marginal gains. By breaking everything down that goes into competing as a cyclist and by improving each element by 1%, he demonstrated how the sum of parts could increase performance. As a result, they won 7 out of 10 gold medals available in track cycling in the 2008 Beijing Olympics and London Olympics four years later.
A load of rubbish right?
Sir Bradley Wiggins, a key member of the Team GB cycling team called the idea of marginal gains rubbish. “At the end of the day, chimp theories and marginal gains and all these buzzwords – a lot of the time, I just think you have got to get the fundamentals right: go ride your bike, put the work in, and you’re either good or you’re not good.”
For me there is truth in both views, you can’t achieve marginal gains without getting the fundamentals right.
This is the central idea I want to put forward in a framework for CX professionals for achieving marginal gains. So lets get to the practical steps for achieving this.
Map your current experience to a Hierarchy of CX needs
Hierarchy is a useful metaphor to think about marginal gains, we tend to think in terms of process, levels and progress (moving up). In the same way, without fulfilling the basic needs of customer experience you can’t and shouldn’t move to the next level. Its difficult, but not impossible, to go from zero experience to hero experience at the top. Like Maslow, you can’t achieve the top level need without achieving the basics.

Here are 5 steps you can take today to achieve this either with notes on the back of an envelope or as a collaborative team activity (with post-it notes):
- Define your CX vision: Ask yourself what is your overarching vision for what you want the customer experience to be.
- Define what you do and how you do it to meet your CX vision: Think about how you deliver your CX vision through your products or services. Then group your activities by importance:
- Basic: For example, a retail store’s basic activity is keeping the store clean and the lights working.
- Essential: For example, this could be that you offer home delivery like your competitors
- Differentiator: For example, this can be that you offer your next day delivery for free to enhance CX.
- Measure: once you have looked internally at your activities you can look externally to see how these activities really match up with your CX vision.
Outside-in: Bring the customer to the table
How your customers feel about customer experience is critical. Measuring and establishing a baseline is one of the first steps you need to take to test against each stage of the hierarchy. Do this by working backwards from specific customer touch points and see what data is available. This could be Net Promoter Score verbatim, SurveyMonkey, ZenDesk tickets or even social data. Later in this post, I demonstrate how we used this approach using Adoreboard’s Emotics platform to understand customer emotions for United Airlines based on social data.
Measure for fraction or magic
Using Adoreboard’s emotionally intelligent insight system, we can test each stage of the hierarchy by measuring the emotion against the theme. If we take Apple, for example, a differentiator driving joy could be a good experience at the Genius bar or the Hour of Code workshops hosted instore. This insight could be broken down to see what aspects of the experience could be further optimised.
Similarly, you might find that software updates are a source of friction in the basics level of the hierarchy. People want software updates but do they need one for every emoji keyboard update?
In the essential level of the hierarchy, you might find that battery life and charger is another source of friction. If excecuted well fixing battery life could become a differentiator. At the same time, there is a note of caution. Obviously, competitors such as Samsung understand that battery life is a key differentiator and went for a big bang fix rather than a marginal gain. We can all remember the global product recall of Samsung phones going on fire.
View customers as people
Finally, it is important to flip your mindset from viewing customers as statistics to viewing customers as people. With this mindset, I believe the marginal gains will come more naturally and quickly. Alex Genov, head of Customer Research at Zappos articulated this idea in a recent keynote ‘Customers as People’. He suggested the one thing that stands in the way of most companies acheiving excellent customer experience is that they don’t understand their customers as people. He suggests that when customers become statistics, dangerous things can happen. Highlighting that when companies like United Airlines fly over 150 million passengers each year, it’s easy to forget they’re not just numbers. This results in companies putting regulations and targets ahead of passenger needs. Leading to incidents like the “involuntary deboarding” scandal of 2017 when a video went viral showing a passenger being forcibly dragged off an overbooked flight.
This is a well worn example of what happens when Customer Experience goes wrong. But the business impact of this story, the fact that United lost $250 million in stock value, fascinates me and something that also caught the imagination of the data scientists at Adoreboard.
In an experiment to explore the link between customer emotion and stock value, we looked at over 25000 social media posts to the United Airline customer care Twitter handle between February 2017 to June 2017. We used Adoreboard’s Emotics AI emotionally intelligent system to understand the emotional properties of the content shared by people contacting the customer service handle based on Plutchik’s wheel of emotion.
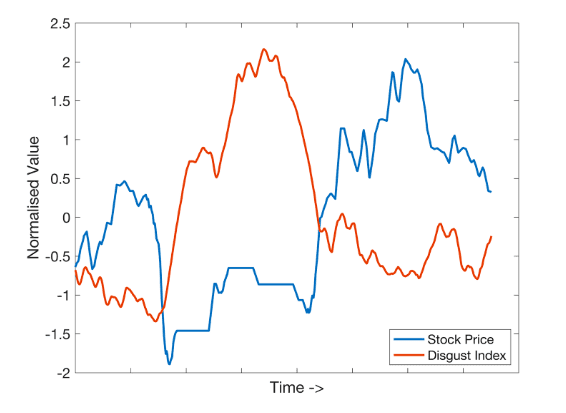
Notably, the results show a negative correlation between disgust (-0.47) and sadness (-0.50) with the stock price. This means that as the stock prices rose, disgust drops and vice versa. Also, most of the indexes like joy (emotions: serenity, joy and ecstasy) are highly correlated. This shows that these emotions move with the stock price. It should be noted that the correlation for stock vs. emotion will never be perfect as one is reactive to the other, so the scores will always be slightly offset depending on if stock price reacts to emotion or emotion reacts to the stock price.
If United Airlines had looked at the human experience of the approx 3,700 passengers involved in involuntarily deboarding compared to the 150m journeys per year to its CX vision could it have created a different outcome for its shareholders?
If we look at the day in question we found that the stock price dropped from $71.53 to $69.07, this constitutes a drop of $2.46 or 3.44%. This equates to an increase from 28.24 to 32.94 in the disgust index. This is a 4.7 score increase or 14.27%. The chart below shows this effect:
Similarly, if we look at joy following chart shows stock price movement alongside joy, this illustrates how the correlation of joy follows stock price:
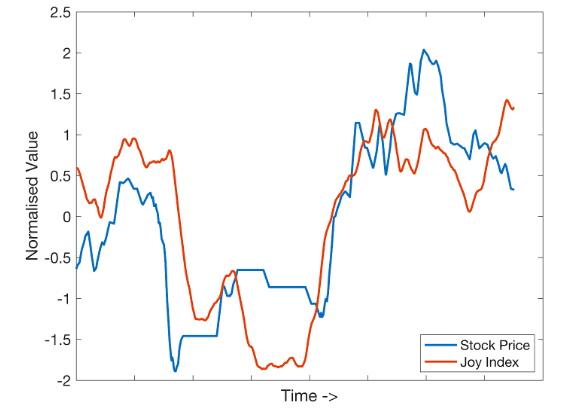
In theory, we can show that joyful experiences expressed by customers can predict stock price movement. By using a regression model, we were able to identify the correlation between a prediction and stock price is 0.69, this is 0.04 points higher than the best previous correlation for joy. This regression model can then be used to predict stock price movement – for me, this about showing how customer emotion reflected in the customer experience they receive can drive both good and bad shareholder outcomes.
So marginal gains, creating joyful customer experiences by getting the basics, essentials and differentiators right have a tangible and for firms like United Airline have a profound impact on the bottom line. The opportunity for you to create impactful CX experiences based on the steps and measurement system outlined here. So what are you waiting for?
[1] https://www.bbc.co.uk/news/magazine-34247629